If you don’t have the Azure PowerShell module installed and you are running PowerShell 7 or higher, you can install it using PowerShellGet. In case you don’t have it, to install PowerShellGet you can run the following commands:
[Net.ServicePointManager]::SecurityProtocol = [Net.ServicePointManager]::SecurityProtocol -bor [Net.SecurityProtocolType]::Tls12
Install-PackageProvider -Name NuGet -Force
Set-PSRepository -Name PSGallery -InstallationPolicy Trusted
To install the actual Azure PS module run:
Install-Module -Name Az -Scope CurrentUser -Repository PSGallery -Force

You can connect to the Azure subscription using:
Connect-AzAccount -Credential (Get-Credential)

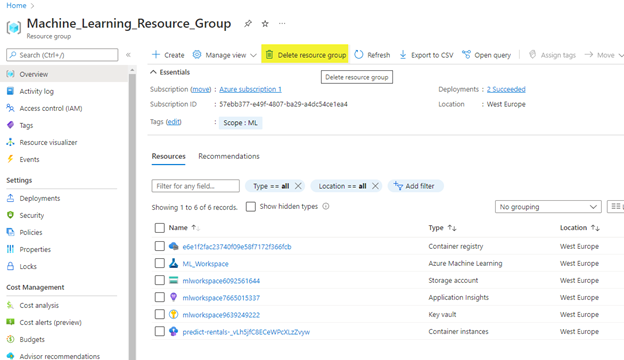
New-AzResourceGroup -Name "Machine_Learning_Resource_Group" -Location "West Europe" -Tag @{Scope="ML"} -Verbose

Create an Azure Machine Learning workspace


Once complete, under Compute, select Compute clusters and select New.

Select the following settings


When finished the output will look like this:


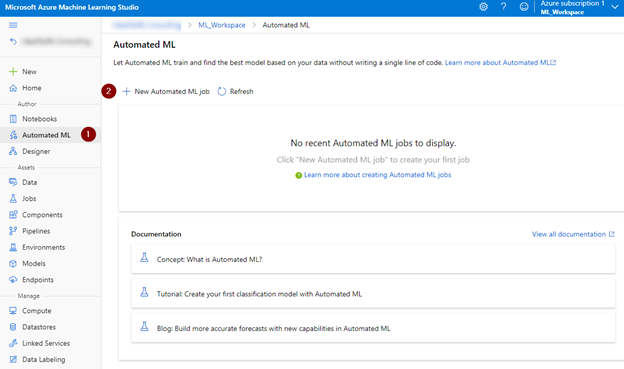
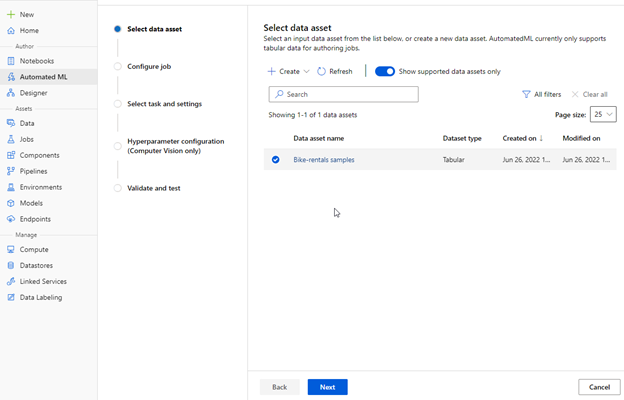
Azure Machine Learning includes an automated machine learning capability that automatically tries multiple pre-processing techniques and model-training algorithms in parallel.
Note
The automated machine learning capability in Azure Machine Learning supports supervised machine learning models – in other words, models for which the training data includes known label values. You can use automated machine learning to train models for:
- Classification (predicting categories or classes)
- Regression (predicting numeric values)
- Time series forecasting (predicting numeric values at a future point in time)
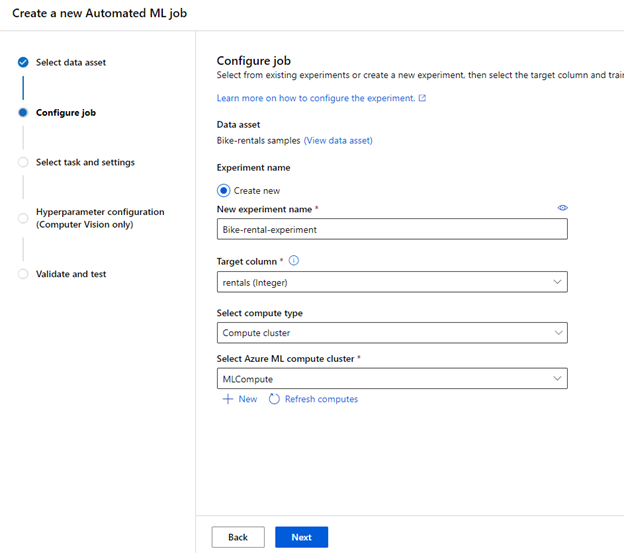
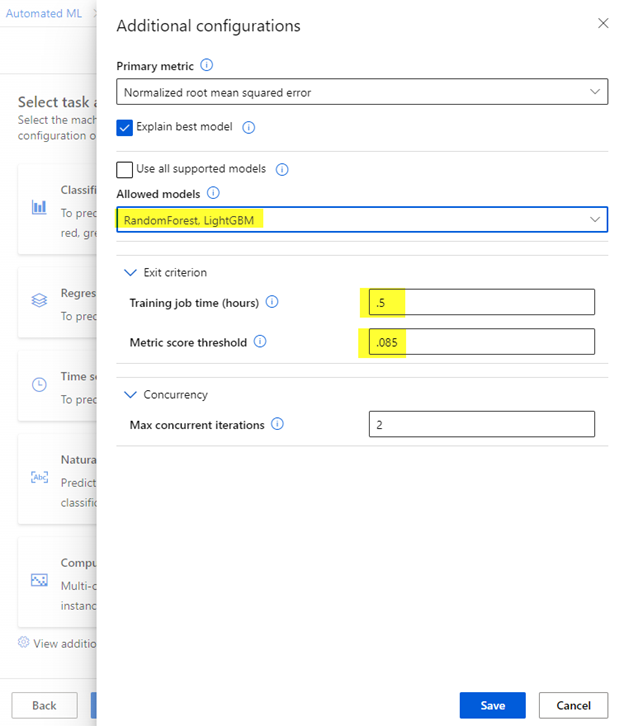
In the Target column select the label that the model is trained to predict.
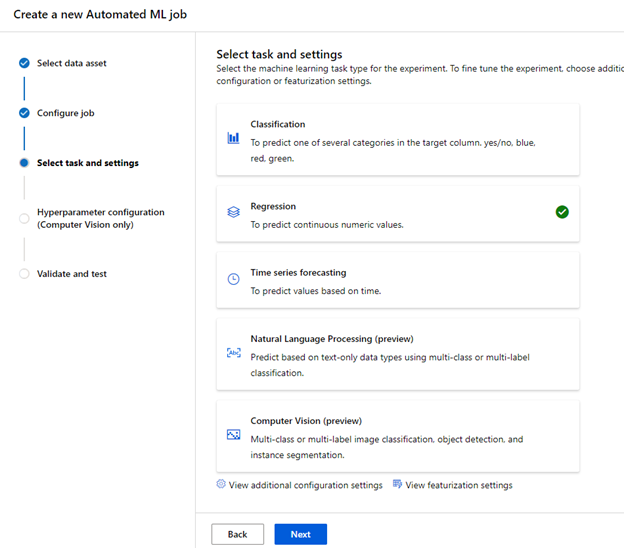
Go to View additional configuration settings and View Featurization settings.
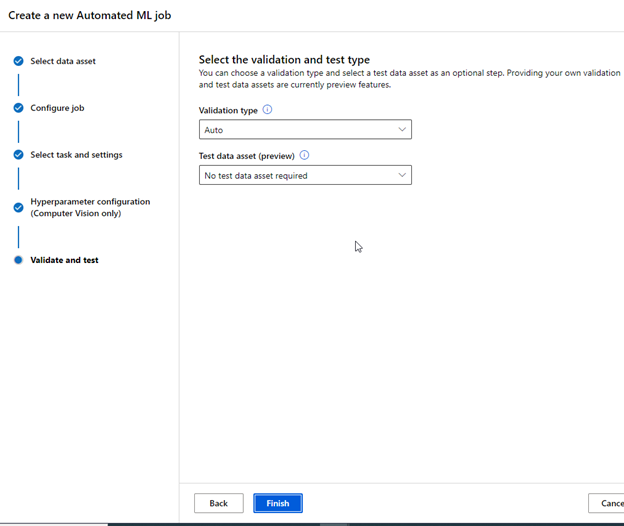
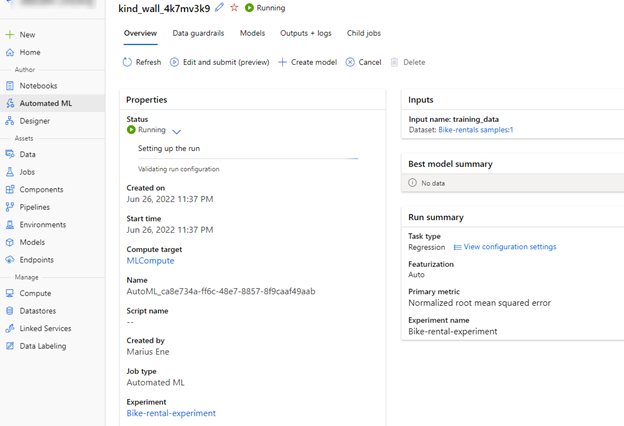
When the run status changes to Running, view the Models tab and observe as each possible combination of training algorithm and pre-processing steps is tried and the performance of the resulting model is evaluated.
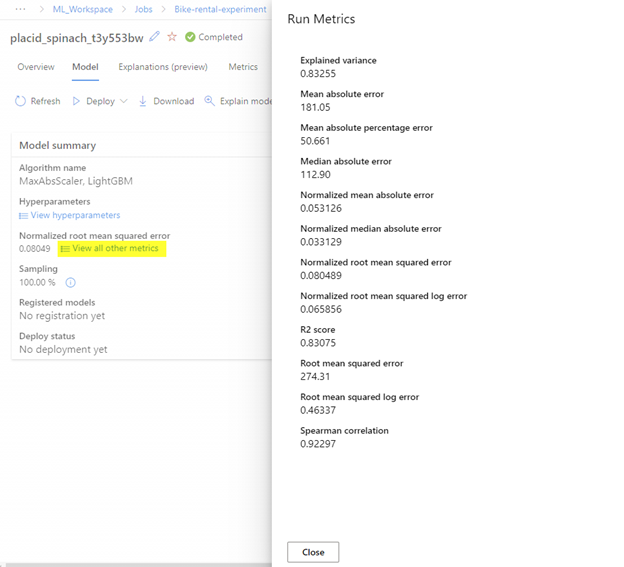
To calculate the evaluation metric, a technique called cross-validation is used, meaning that out of all the sample data provided, a portion of the data is used to train the model while the other portion is used for testing and validation.
Residuals, is the term given to the error difference between the predicted and the actual value.
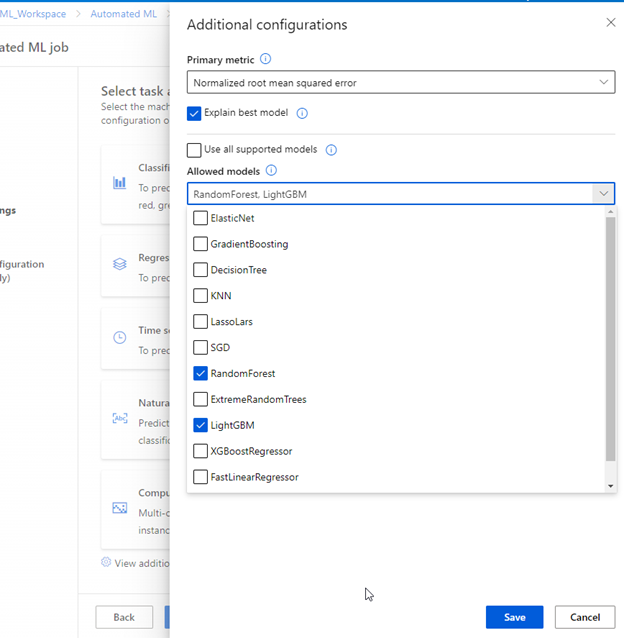
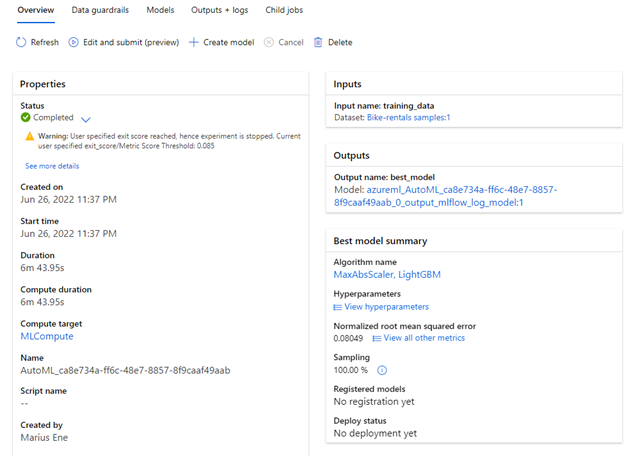
The normalized root mean squared error, is calculated by squaring the errors across all the test cases, finding the mean of these squares, and then taking the square root. The smaller this value is, the more accurate the model’s predictions.
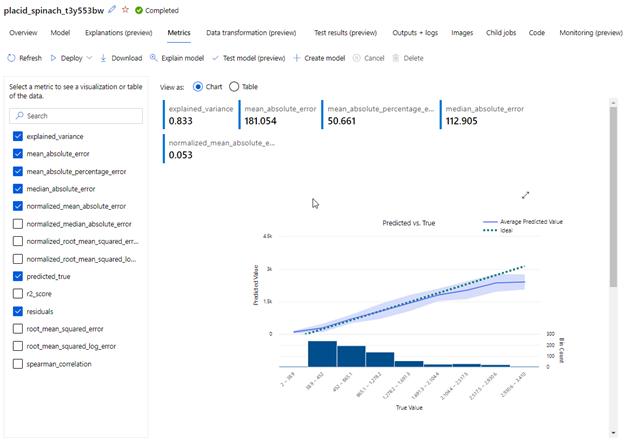
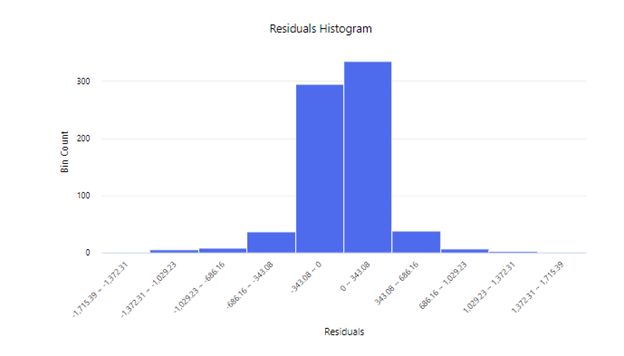
The Residual Histogram shows the frequency of residual value ranges. Residuals represent variance between predicted and true values that can’t be explained by the model, in other words, errors. You should hope to see the most frequently occurring residual values clustered around zero. You want small errors with fewer errors at the extreme ends of the scale.
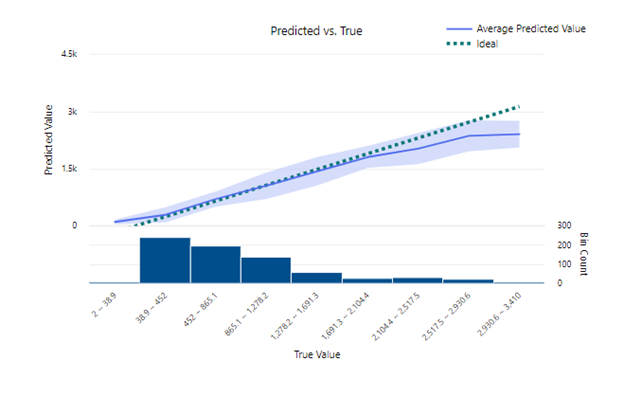
The Predicted vs. True chart should show a diagonal trend in which the predicted value correlates closely to the true value. The dotted line shows how a perfect model should perform. The closer the line of your model’s average predicted value is to the dotted line, the better its performance. A histogram below the line chart shows the distribution of true values.
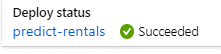
Then, in the Model summary section, observe the Deploy status for the predict-rentals service, which should be Running. Wait for this status to change to Successful, which may take some time. You may need to select Refresh periodically.

At the end, don’t forget to cleanup the lab.